Fleet-scale water extraction monitoring on the Orange River
We engineered a sub-device mapping layer, hierarchical access control, and an expression-based rules engine to give a water consultancy unified visibility across 900+ flow meters on the Orange River — from flat Modbus register dumps to individually identifiable, health-scored entities.
- 900+flow meters as distinct entities
- 7,200+sensor channels ingested
- 0manual device registrations
1. Executive Summary
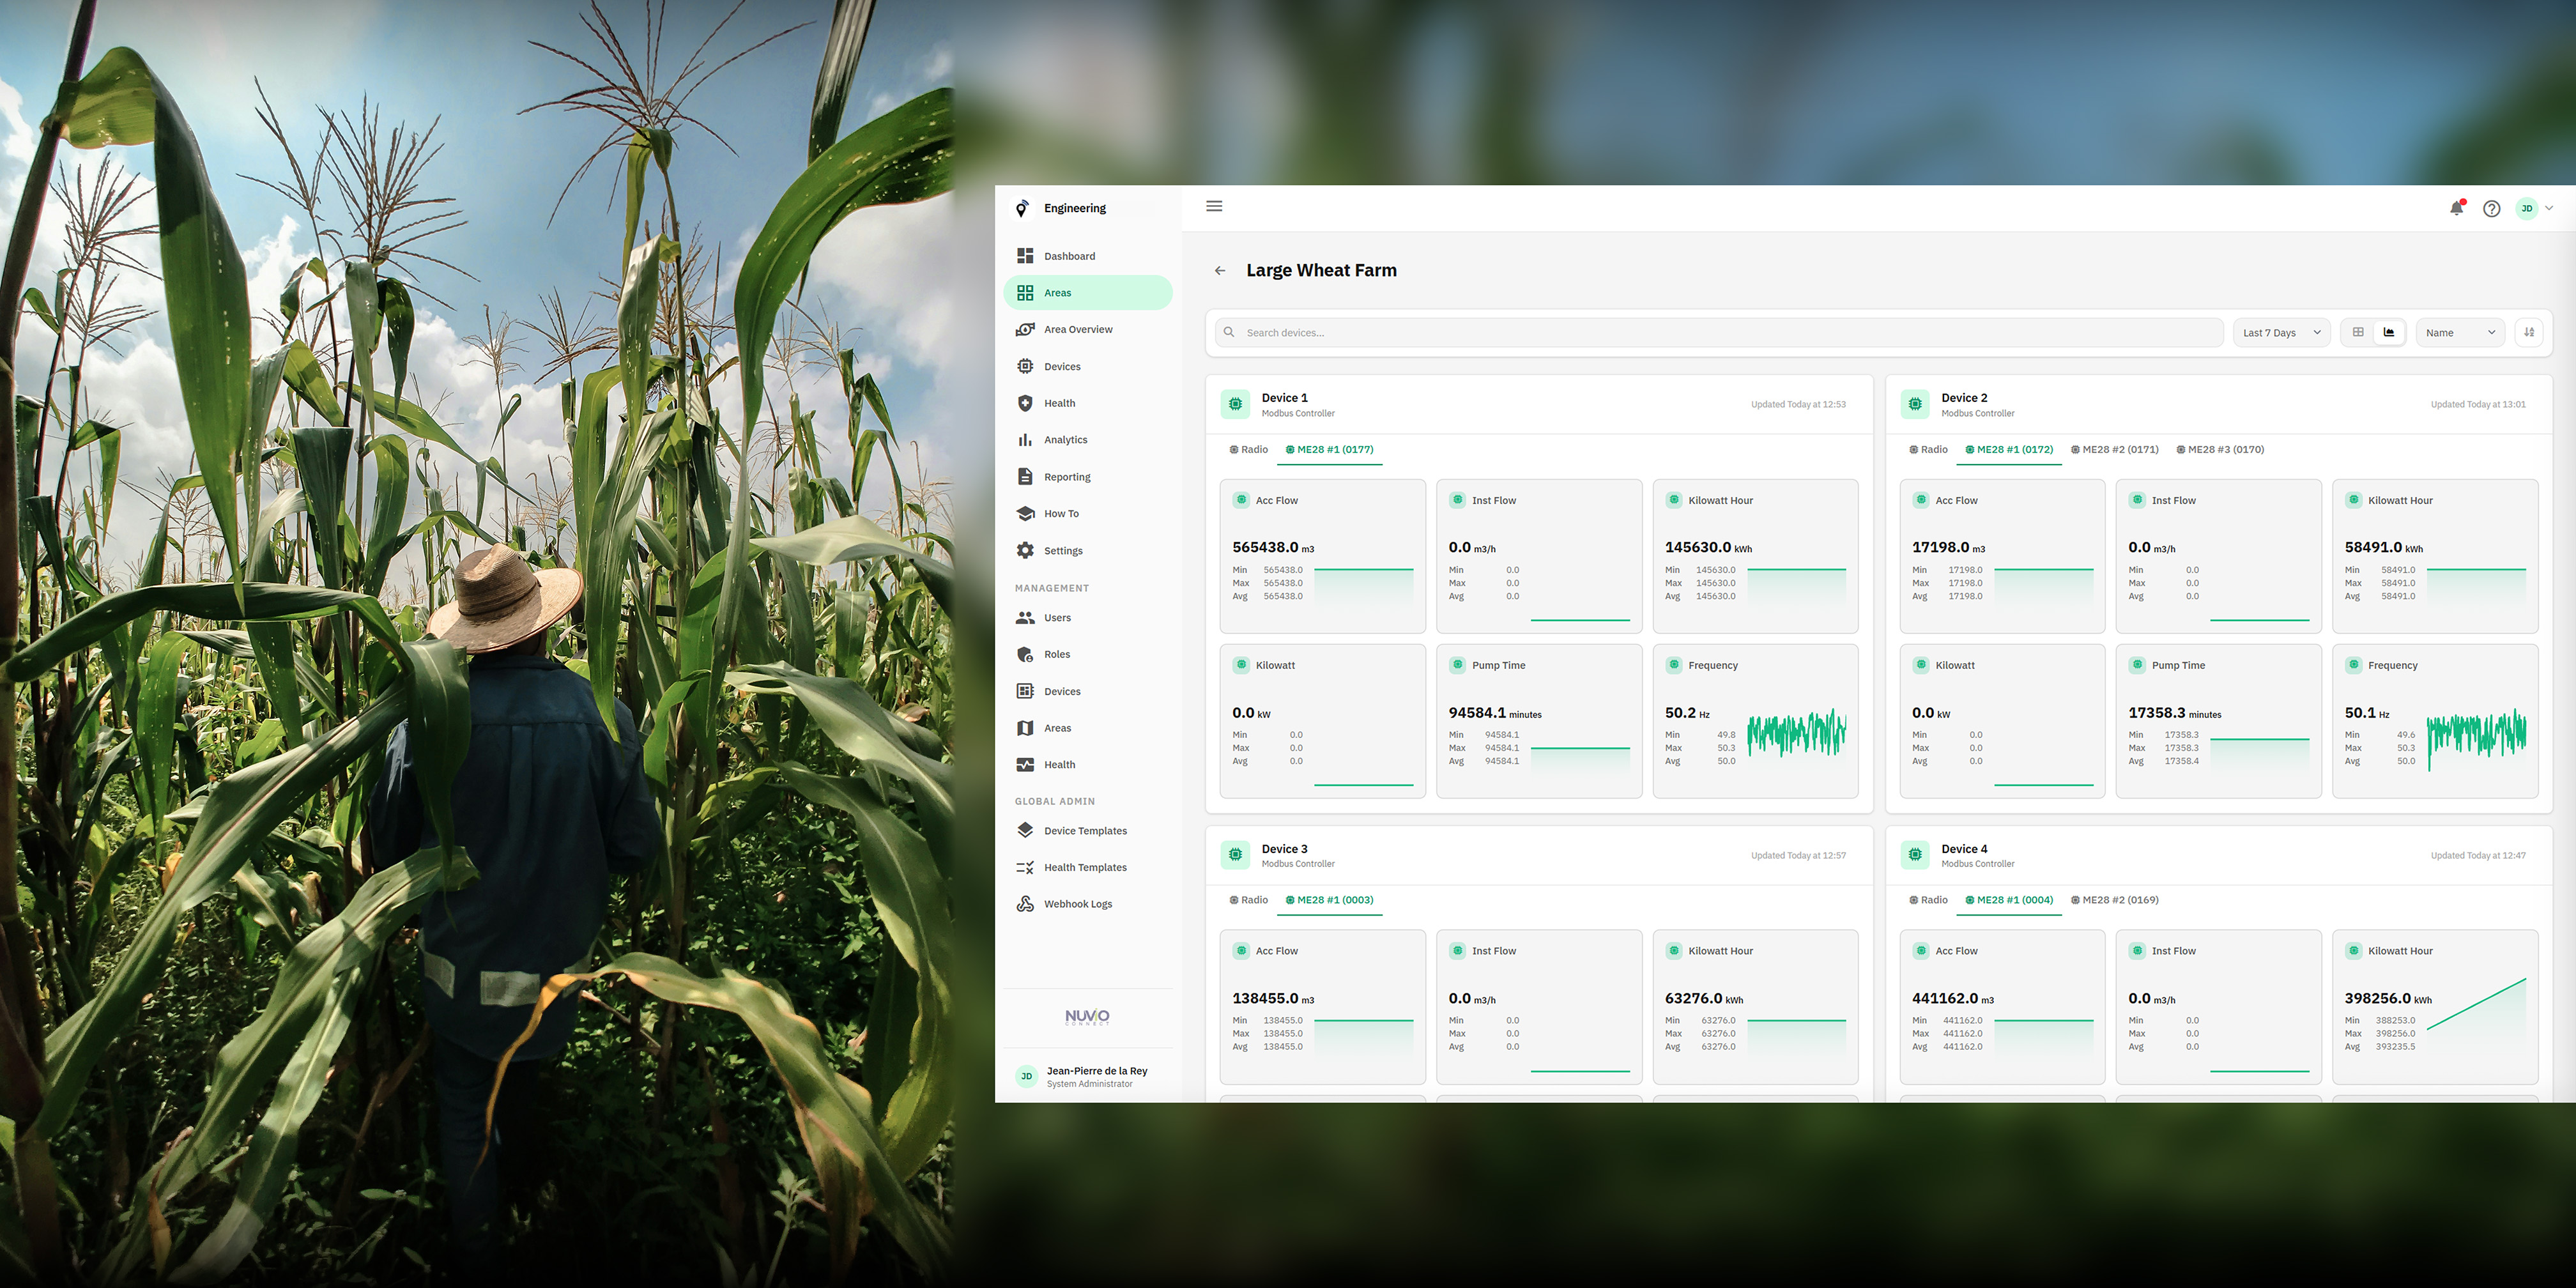
A water management consultancy operating along the Orange River in South Africa needed to monitor agricultural water extraction across hundreds of farming operations. Their infrastructure — hundreds of LoRa radios each connected to multiple flow meters via Modbus blocks — produced a large fleet of logical devices and thousands of sensor channels. The LoRaWAN payloads arrived as flat, chunked Modbus register dumps tied to the radio rather than packaged per flow meter, and the meters' hardcoded identifiers were unreliable across hardware servicing. The client needed every flow meter to appear as its own distinct entity on a centralised dashboard, organised by region and farm, with role-based access control and intelligent monitoring rules across the entire fleet. We engineered a sub-device mapping layer for stable per-meter identity, a hierarchical grouping system for fleet organisation and access control, and a custom expression-based rules engine for severity-weighted health monitoring at scale. The deployed solution now provides unified visibility across all 900+ flow meters with automatic device provisioning, inactivity detection, geofenced map visualisation, and flexible alerting — capabilities that have since become core features of the Nuvio platform.
2. Client Background
The field infrastructure consists of approximately 300 LoRa radio units deployed across farming sites. Each radio is connected to roughly three flow meters via Modbus interface blocks, giving the consultancy a fleet of around 900 logical metering devices producing data across approximately 7,200 sensor channels. The radios communicate over LoRaWAN, transmitting sensor data to The Things Industries (TTI) network, which acts as the LoRaWAN broker.
Before our intervention, the consultancy had no centralised way to view, organise, or monitor this device fleet. There was no single dashboard showing all meters, no grouping by farm or region, no role-based access allowing individual farmers to see only their own data, and no automated alerting when devices went offline or sensor readings fell outside expected ranges. The raw data existed on the TTI network, but translating it into actionable operational visibility required a purpose-built solution.
The client sought improvement to achieve:
- Centralised visibility: A single dashboard where every flow meter appears as its own identifiable entity with live sensor data, historical trends, and health status.
- Fleet organisation: The ability to group devices by region, farm, and section — mirroring the real-world geographic and organisational structure.
- Access control: Role-based permissions so that each farmer sees only their meters, regional managers see their jurisdiction, and administrators see the full fleet.
- Intelligent monitoring: Flexible alerting rules that can target sensors across the entire fleet without requiring per-device configuration.
- Operational efficiency: Automatic device provisioning and offline detection to minimise manual administration.
3. The Challenge
The consultancy's requirements created several interconnected engineering challenges:
Flat, Chunked Payloads with No Per-Meter Structure
The LoRaWAN payloads arriving from each radio are flat Modbus register dumps. A single uplink contains numbered registers for all attached meters in one undifferentiated stream — there is no packet-level separation between one flow meter's readings and the next. They are simply consecutive register addresses in the same payload. Payloads may also arrive in partial chunks depending on radio configuration and network conditions, meaning the platform cannot assume a complete, neatly bounded set of readings per meter in every transmission.
Unstable Flow Meter Identifiers
The flow meters do expose a hardcoded identifier through one of their Modbus registers, but this ID can change when a meter is serviced, recalibrated, or replaced — making it unreliable as a stable, long-term identity. Only the LoRa radios carry a truly unique, permanent hardware identifier. The client needed each flow meter to appear as its own entity on the dashboard with a stable identity that persists across hardware changes.
Fleet Scale and Organisation
With approximately 900 flow meters across dozens of farming operations, the dashboard cannot present a single flat list of devices. Farmers need to see only their own meters. Regional managers need to see their jurisdiction. Administrators need to see everything, but organised by area. Beyond navigation, access control is critical — a farmer on one property must not be able to view or modify devices on another, and permissions must follow the organisational hierarchy.
Complex Monitoring Requirements
Traditional IoT alerting works with simple threshold rules: "if sensor X on device Y exceeds value Z, fire an alert." This approach breaks down at the client's scale:
- 900 devices need the same rule applied without creating 900 individual rule definitions.
- Rules must reference multiple sensors on the same device (e.g., "alert when flow rate is above threshold AND site power is off").
- Aggregate rules across groups of devices are needed (e.g., "alert when the average flow rate across all meters in a group exceeds the permitted allocation").
- Alerts have different severities, and the overall health of a device should reflect the weighted combination of all its triggered alerts.
Deployment and Maintenance at Scale
With 300 radios deployed across a large geographic area, manually registering each device in the dashboard and monitoring connectivity status by hand would be impractical. The solution needed to handle device onboarding and offline detection automatically.
4. Solution Overview
We designed a complete data pipeline from field sensor to dashboard, addressing each challenge through purpose-built platform capabilities.
High-Level Architecture
Flow meters → LoRa radios (Modbus) → LoRaWAN → TTI network server → Webhook ingestion → Device resolution → Sub-device mapping → Sensor storage → Health evaluation → Cloud-hosted dashboard
Our approach centred on four key pillars:
Sub-device mapping: A JSON configuration model stored on each radio's device record that defines how flat Modbus channels are grouped into logical flow meter entities. Each flow meter receives a stable site identifier tied to its physical location rather than to any hardware ID, ensuring identity continuity across radio swaps and meter servicing.
Hierarchical device groups: A nested grouping system with customisable group names at every level, allowing the hierarchy to mirror any organisational structure (e.g., regions, farms, sections — or any naming convention the client prefers). Users assigned to a group automatically inherit access to all descendant groups. Groups can be represented as geofenced areas on an interactive map, with device GPS coordinates displayed as colour-coded markers that reflect real-time health status. Server-side authorisation ensures UI filtering cannot be bypassed.
Expression-based health policies: A custom domain-specific language (DSL) for defining monitoring rules that target sensors using path-based wildcards. A single rule definition covers the entire fleet. Rules carry severity weights (critical, warning, informational) and produce a normalised health score per device and per sub-device.
Automated fleet management: Auto-provisioning of new radios on first uplink using the radio's unique hardware identifier, with background inactivity monitoring that flags offline devices based on configurable thresholds.
Key Technologies
- LoRaWAN protocol with The Things Industries (TTI) as network server
- Webhook-based data ingestion with structured payload logging
- Sub-device mapping via per-device JSON configuration
- Custom expression DSL with lexer, parser, AST, and evaluator
- Path-based sensor targeting with wildcard matching and aggregation functions
- Severity-weighted health scoring
- Hierarchical groups with cascading user assignments and role enforcement
- Automatic device provisioning from the radio's unique hardware identifier
- Background inactivity monitor with configurable offline thresholds
- Cloud-hosted dashboard with per-device and per-sub-device views
Why This Approach
This deployment demanded more than a standard monitoring dashboard. The client needed granular control over how devices are identified, how they are organised across a complex hierarchical structure, and how they are monitored at fleet scale. Every layer — from payload parsing and identity assignment to geographic grouping, map-based visualisation, role-based access, and expression-driven alerting — was tailored to fit the operational reality on the ground. The result is a solution shaped around the client's specific workflow rather than one that forces the client to adapt to a platform's assumptions.
5. Implementation
1. Webhook Integration and Data Ingestion
We configured a webhook endpoint on the TTI network to receive LoRaWAN uplink events. Each incoming payload is validated, logged to the webhook log table, and queued for background processing. The ingestion layer handles the full range of TTI event types (uplink messages, join events, downlink acknowledgements) but fully processes only uplink payloads containing sensor data.
2. Device Resolution and Auto-Provisioning
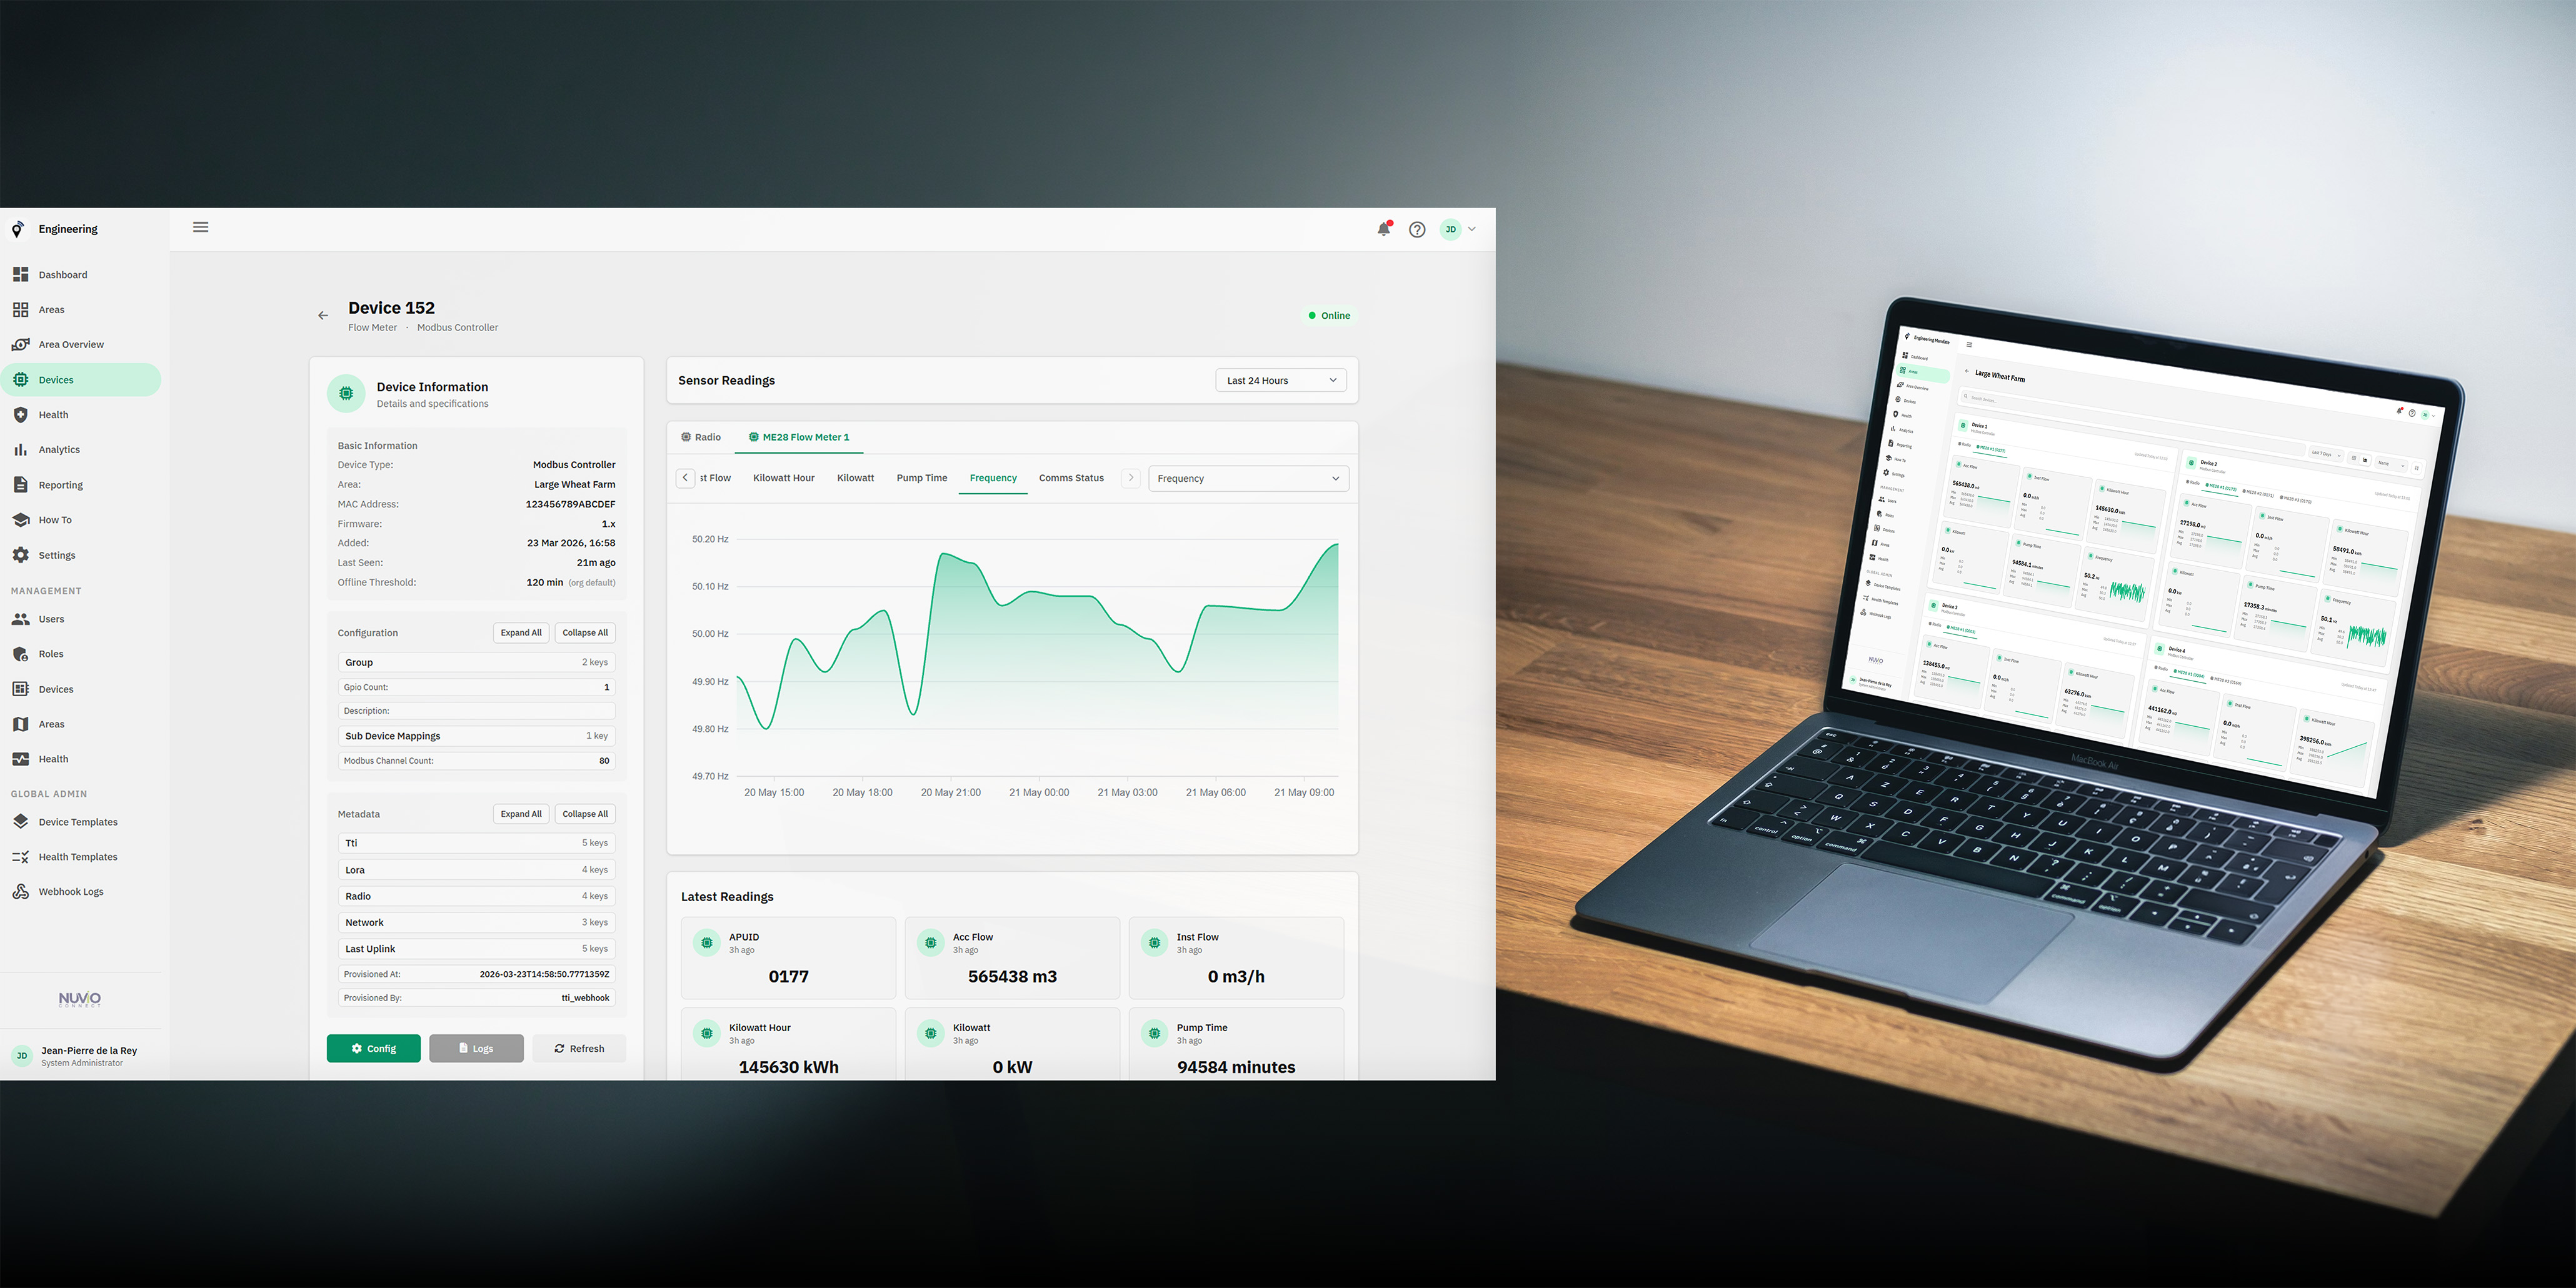
When a payload arrives, the device resolver looks up the radio by its unique hardware identifier. If no matching device exists, one is automatically created: the device type is inferred from the payload metadata, a default sensor configuration template is applied, and the device is immediately available on the dashboard. This auto-provisioning flow eliminates manual device registration for the entire 300-radio fleet.
3. Sub-Device Mapping Configuration
For each radio, we defined a structured JSON configuration that maps its flat Modbus channels into logical sub-devices. Each sub-device group specifies:
- A human-readable name (e.g., "Pump Station North — Meter 1").
- A stable site identifier that persists across hardware swaps.
- A device type driving type-specific rendering and unit conversion.
- An identity channel — the Modbus register containing the meter's hardcoded identifier, used as a cross-reference rather than the primary identity.
- A list of data channels, each mapped to a labelled sensor with appropriate units (e.g., "Flow Rate" in m³/h, "Total Volume" in m³).
Channels belonging to the radio itself (RSSI, SNR, power status, and other link-quality indicators) are classified as system channels and displayed at the radio level. The mapping is applied during payload processing: the platform parses the flat register dump, fans it out into separate per-meter reading sets, and stores each as an independent sensor record.
4. Hierarchical Groups and Access Control
We built a groups feature with a nested hierarchy where each level's name is fully customisable — in this deployment configured as regions, farms, and sections, but adaptable to any organisational structure. Users are assigned to groups with role-based permissions, and assignments cascade downward through the hierarchy. Role hierarchy enforcement prevents lower-role users from granting or revoking access for higher-role users, with server-side authorisation checks ensuring UI filtering cannot be bypassed.
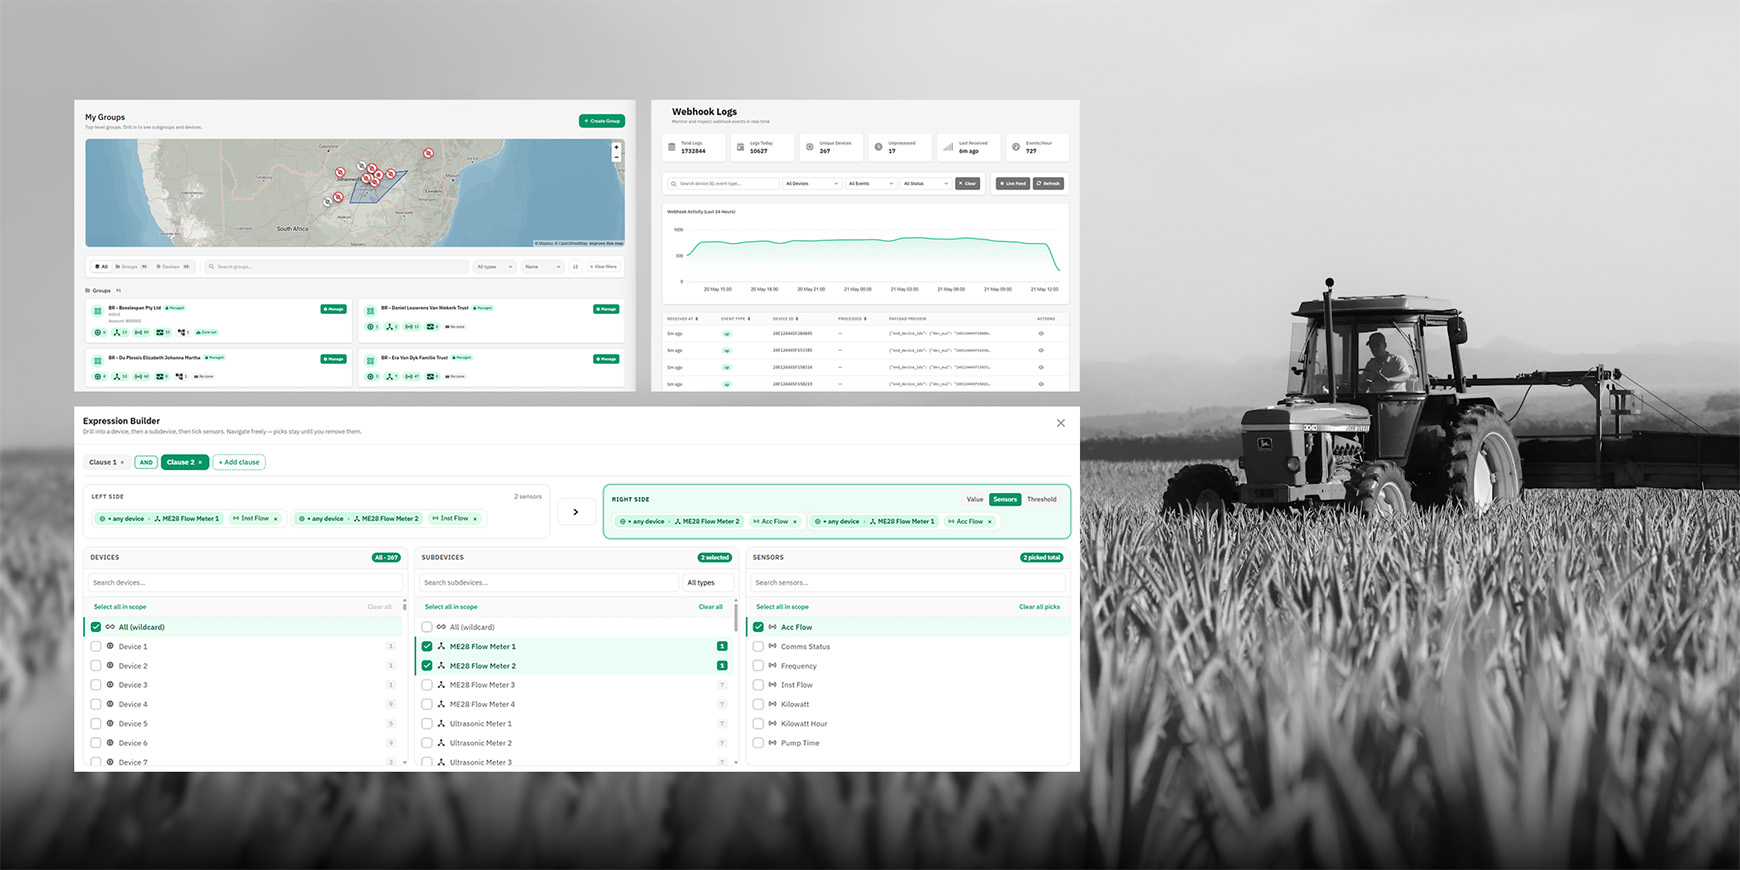
Each group can be represented as a geofenced area on an interactive map, giving operators a spatial view of the fleet that mirrors the organisational hierarchy. Device GPS coordinates are plotted as map markers whose colour reflects real-time health status — green for healthy, amber for warning, red for critical — allowing field teams to identify problem areas at a glance without navigating through device lists.
5. Expression-Based Health Policy Engine
We developed a custom expression engine that lets administrators define monitoring rules in a flexible, human-readable language. Rather than configuring alerts one device at a time, the engine supports:
| Capability | Description |
|---|---|
| Targeted monitoring | Rules can address a specific sensor on a specific device, or a specific sub-device within a radio. |
| Fleet-wide wildcards | A single rule can target every matching sensor across the entire fleet — e.g., monitoring battery levels on all 900+ meters at once. |
| Multi-condition logic | Rules can combine multiple conditions with boolean logic — e.g., "alert when a meter reports zero flow rate while total volume is still incrementing," catching stuck or miscalibrated sensors that a single-threshold rule would miss. |
| Aggregation | Rules can evaluate aggregate values across groups of devices — averages, totals, minimums, maximums, and counts. |
| Severity levels | Each rule carries a severity (critical, warning, or informational), and the platform produces a weighted health score per device reflecting the combined state of all its triggered rules. |
A web-based expression builder lets administrators construct rules by selecting devices, sub-devices, and channels from column pickers, reducing the chance of errors and making the system accessible to non-technical operators.
6. Inactivity Monitoring
A background service tracks the last-seen timestamp for each webhook-connected device. If a device does not transmit within a configurable threshold (defaulting to 60 minutes), it is automatically marked as offline, giving operators immediate visibility into field connectivity issues.
6. Results & Impact
Quantifiable Outcomes
- 900+ flow meters as distinct entities: Every flow meter appears as its own individually identifiable device on the dashboard, with its own sensors, charts, and health status — despite the meters sharing radio hardware and lacking stable unique identifiers.
- 7,200+ sensor channels ingested: Live data from approximately 300 LoRa radios flows through the LoRaWAN/TTI webhook pipeline into the dashboard continuously.
- Automatic device provisioning: New radios appear on the dashboard the moment they join the network and transmit their first reading, with no manual registration required.
- Automated offline detection: Devices that stop transmitting are flagged automatically, providing immediate visibility into field connectivity issues.
- Fleet-wide monitoring from single rule definitions: One expression rule covers every matching device in the fleet via wildcard paths, eliminating the need for 900 individual rule configurations.
- Severity-weighted health scoring: Per-device and per-sub-device health scores give operators a nuanced view of fleet health, with critical issues dominating the score.
Qualitative Improvements
- Unified operational visibility: For a client that previously had no centralised view across their fleet, having every device and every sensor accessible in one place — with live data, historical trends, and health status — was a transformative outcome in itself.
- Geographic organisation: The nested grouping system — with customisable group names at every level — mirrors the client's real-world structure, making a 900-device fleet as navigable as a 10-device deployment. Geofenced map areas and colour-coded device markers provide an at-a-glance spatial view of fleet health across the entire river corridor.
- Access control and data privacy: Each farmer sees only their own meters. Regional managers see their jurisdiction. Administrators see the full fleet. Permissions cascade through the hierarchy and are enforced server-side.
- Stable device identity: Flow meters retain their dashboard identity across radio swaps and meter servicing, ensuring historical data continuity and eliminating confusion when hardware changes in the field.
- Reduced manual administration: Auto-provisioning and inactivity monitoring remove the need for manual device registration and connectivity checks across a geographically dispersed fleet.
7. Conclusion
This project demonstrates our capability to deliver end-to-end IoT monitoring solutions that go beyond what standard platforms offer. The core challenge — transforming flat, chunked Modbus register dumps from shared radio hardware into individually identifiable flow meter entities with stable identities — required purpose-built engineering at every layer: data ingestion, device identity, fleet organisation, and monitoring logic.
The capabilities we built for this project are not one-off solutions. Sub-device mapping, hierarchical groups with role-based access control, and the expression-based health policy engine are now core features of the Nuvio platform, available to every client. Any deployment involving Modbus controllers, multi-sensor hubs, or gateway devices that host multiple logical devices behind a single hardware identifier can leverage the same sub-device mapping pattern. Any fleet that outgrows a flat device list can use hierarchical groups. Any client that needs monitoring rules across hundreds of devices can use the expression DSL instead of configuring alerts one device at a time.
The project also reinforced the value of automatic device provisioning at scale. With 300 radios spread across a large geographic area, manual registration would have created an ongoing administrative burden. The auto-provisioning pipeline — from first uplink to dashboard visibility — ensures that the gap between field installation and operational monitoring is measured in seconds, not days.
8. Future Opportunities
The foundation established through this project provides a platform for continued expansion:
- Additional device types: The sub-device mapping framework supports any Modbus-connected sensor type. As the consultancy expands its monitoring beyond flow meters (e.g., water level sensors, weather stations, soil moisture probes), new device types can be onboarded through configuration alone.
- Water budget management: Real-time tracking of actual water consumption against per-farm or per-region usage allocations, with automated alerts as extraction approaches permitted limits — tying directly into the regulatory framework governing Orange River water rights.
- Predictive analytics: Historical sensor data across 7,200+ channels provides a rich dataset for identifying patterns that precede equipment failures, flow anomalies, or connectivity issues.
- Rainfall and weather correlation: Integrating rain gauges and weather stations into the existing LoRaWAN infrastructure to overlay rainfall data against extraction volumes on the dashboard — enabling the consultancy to correlate precipitation patterns with water usage trends and provide farmers with a more complete picture of the water cycle on their land.
- Deeper TTI integration: Leveraging additional TTI event types (location data, downlink commands) for geolocation tracking and remote device configuration.
- Expansion to other river systems: The entire solution — webhook ingestion, sub-device mapping, hierarchical groups, expression rules — is tenant-isolated and replicable. Deploying for additional water management consultancies along other river systems requires configuration, not re-engineering.
The platform capabilities built for this single client now serve as proven, reusable infrastructure for any large-scale IoT monitoring deployment where logical device identity, fleet organisation, and expression-based alerting are required.